Understand color science to maximize success with LEDs – part 4 (MAGAZINE)(UPDATED)
+++++
This article was published in the February 2013 issue of LEDs Magazine.
+++++
Much of the technical focus on LEDs and solid-state lighting (SSL) to date has been on component and system efficacy and the potential for saving energy, but lighting quality matters as well. In this part of our color-science series, we will see how high efficacy and good color rendering are conflicting goals. Moreover, we will address how the industry is attacking the problem of developing efficient and high-quality light sources.
In the first article of this series we established three foundational principles of color vision: 1) The relative response of the three types of cone cells in the retina is sufficient to explain color vision; 2) metamerism which is a direct result of the first principle; and 3) color can be characterized by numerous sets of color-matching functions, all of which are linear transformations of each other.
In the second article, we used these principles to explain the origins and uses of the CIE Color Diagram including predicting the color coordinates in the CIE Color Diagram for mixtures of colors. We also discussed the origins of the Planckian locus, a curve through the center of the CIE Diagram which plots the color coordinates of a particular type of white light sources known as blackbody radiators. In the third article in the series, we built upon this knowledge to show how to design LED-based illumination devices which mix the light from different color temperature white LEDs and from colored LEDs to achieve results not possible with white LEDs of the same color temperature alone.
In this article, we will look at color rendering properties of white LEDs. Color rendering refers to how the color appearance of illuminated objects can change when illuminated by different light sources. Naturally we expect colors to shift somewhat when illuminated by light sources with different correlated color temperatures (CCT). We are aware of the change in colors of objects outdoors from noon to sunset on a sunny day. You may have even had the experience of choosing a paint color at the store under natural or fluorescent lighting and then being disappointed in the color of that paint as it appears on your walls at home under incandescent lighting. Both of these examples of color rendering are within our common experience, are to be expected, and in part can be explained by different CCTs of the light sources.
What is less apparent, though, is that the color of an illuminated object can change significantly when shifting from one illumination source to another, even when both sources have the exact same CCT and even when they have the exact same chromaticity coordinates. To understand how this can happen, let’s review and apply our first two principles of color vision.
Our first principle of color vision states that the colors we see are directly related to the relative response of the three types of cone cells in the retina to the spectral power distribution (SPD) of the light falling on the cone cells. This means that two light sources with widely divergent SPDs can nonetheless still result in the same relative response of the three types of cone cells and hence look like the exact same color. This is also why a mixture of the light from a red, a green and a blue LED can have the same color as a 3000K incandescent lamp, even though the SPDs of the lamp and the LED mixture are vastly different. As long as the cone responses to the two SPDs are identical, then the two sources will look identical in color. This phenomenon is called metamerism, and is our second principle of color vision. Any two or more SPDs that have the same chromaticity coordinates are metamers of each other.
Reflected light
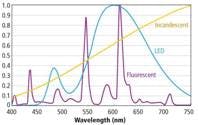
The situation changes when we view reflected light from two or more metameric light sources. In this case, the spectral content of the light coming from each source is modified by the spectral reflectance properties of the object the light is reflecting off of before it enters our eyes. A blue object for instance reflects at the blue end of the spectrum, roughly 400-500 nm, and absorbs the medium to long wavelengths. Consequently, the SPD of the reflected light now is a function of both the SPD of the source and the spectral reflectance properties of the illuminated object (Fig. 1).
The lighting industry has faced this problem in the past and developed the color rendering index (CRI) metric to quantify the color rendering properties of a particular light source compared to that of an incandescent source for low color temperatures (< 5000K) and to daylight for high color temperatures (> 5000K). If the match is perfect, meaning that colors appear or render the same under the light source in question as they do under daylight or an incandescent source, then the index will be an even 100. CRI is not perfect as a predictor of the color rendering performance of a light source, but it does do a reasonable job.
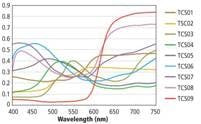
CRI is calculated by comparing the chromaticity coordinates of a set of standard patches or color swatches when illuminated by the light source you are testing and by a reference light source. These standard patches have specific spectral reflectance distributions, meaning the percent reflectance at each wavelength for each patch is specified. Specifying the chromaticity coordinates of the patch is meaningless without specifying a light source illuminating the patch or more precisely specifying the source’s SPD. CRI uses fourteen patches in all. Eight are used to derive the actual CRI value (see sidebar "Calculating CRI" below) and the additional six provide individual measures for specific colors of interest. The patches were chosen to be representative of common materials (Fig. 3).The importance of CRI in SSL
CRI is primarily important for indoor lighting and is less important for outdoor lighting. High-pressure sodium (HPS) street lights for instance, have a very low CRI, in some cases as low as 20. This poor color rendering is offset by exceptional luminous efficacy, which can be as high as 150 lm/W. Color rendering in this application is generally considered unimportant when compared to energy efficiency. Some HPS lamps do have slightly higher CRIs, but at the sacrifice of lower luminous efficacy.
The only outdoor lighting application where high CRI is important is architectural lighting, such as wall washers and floodlights used to illuminate façades and landscapes. A low CRI in an architectural application can significantly detract from the aesthetics of an illuminated building or landscape.
In indoor lighting, CRI is particularly important in residential, retail, and restaurant lighting. Color rendering in office environments is of less importance, because office lighting is designed to provide the best lighting for performing tasks and less so for aesthetics.
LED-based retrofit lamps and to a lesser extent SSL fixtures are starting to make inroads into the residential lighting market. For this market penetration to continue, the cost of the LED lamps and fixtures must continue to come down, while the quality remains high. The higher cost of LED lighting products compared to CFLs and incandescent bulbs can be offset to some degree by the long lifetime of LEDs and by the continuing increases in LED energy efficiency. The quality of LED products though involves more than just reliability. The quality of the light produced by an SSL lamp or fixture is also important, especially to residential customers. The quality of light in SSL is essentially the color rendering quality of the LEDs themselves. Since CRI is our only objective standard to quantify color rendering, it becomes an important product specification along with reliability and luminous efficacy.
Achieving high CRI with LEDs
LED manufacturers often face competing goals, such as cost and performance. Manufacturing high CRI LEDs with high luminous efficacy especially for warm color temperatures is one such challenge. The reason for this has to do with how white LEDs actually create white light.
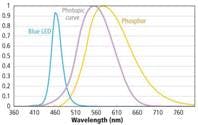
White LEDs are actually blue LEDs coated with a phosphor material. The phosphor absorbs a portion of the blue light from the LED with the rest passing through the phosphor. Some of this light absorbed by the phosphor excites electrons in the phosphor molecules to a higher energy level. As these electrons fall back to lower energy states they emit photons. The spectrum of the light emitted by the phosphor is broadband in nature ranging from 500-700 nm with a peak typically around 550 nm.
If the phosphor were to absorb all of the blue light it would glow yellow. Since it doesn’t absorb all of the light from the blue LED, the transmitted blue light and the yellow light emitted by the phosphor combine to create what appears to be white light. If the mixture has more blue light than white, it will be a cool white with a high CCT. If the mixture has more yellow light from the phosphor than blue light from the LED, it will be warm white with a lower CCT.
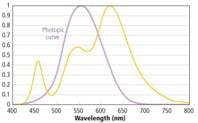
Efficiency and efficacy The optical performance of this LED architecture is rather efficient for two reasons. First, blue InGaN LEDs are very efficient at turning the electrical power supplied to them into optical power. The luminous efficiency of an LED is defined as the optical power in radiant watts of the light exiting the LED divided by the input electrical power in watts. For a typical blue InGaN LED, the efficiency is 30-35%. Despite this high efficiency, blue LEDs have very poor luminous efficacy because the eye is not very sensitive at blue wavelengths. Indeed eye sensitivity is what drives the use of efficacy measured in lumens per watt as the primary figure of merit rather than efficiency. The emission spectrum of the phosphor, however, lines up well with the eye spectral response curve, V(λ) and consequently most of the luminous efficacy of a white LED is due to the yellow light emitted by the phosphor and very little due to the blue light passing through the phosphor (Fig. 4).In fact if we weren’t concerned with color rendering or having the chromaticity coordinates of the LED fall close to the Planckian curve, we could make a super high luminous efficacy LED by using a phosphor whose emission spectra matches the V(λ) curve as closely as possible and then making the phosphor layer thick enough so that all of the blue light from the blue LED was absorbed by the phosphor.
While matching the SPD of an LED to the V(λ) curve as closely as possible will make a very efficient and therefore bright light, it will not make white light. For that, we need some light on the blue and red ends of the spectrum even if the light at those wavelengths contribute little to brightness perceived by the eye. For cool white LEDs this is rather easy to do, by simply letting enough of the blue light from the LED leak through the phosphor.
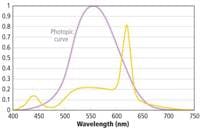
For warm white LEDs, the phosphor must have enough power at the red end of the spectrum to create the warm white CCT. For a 2700K LED, phosphors with a broad emission spectrum are chosen that have a peak emission in the 590-630-nm range. Unfortunately these phosphors also generate a great deal of light beyond 650 nm where the eye has very little response, contributing little to the luminous efficacy of the LED. This is why LEDs with a lower CCT also have a lower luminous efficacy than the cooler color temperature LEDs in the same family.
High CRI, warm CCT
The situation is worse when we want to have a high CRI, low color temperature LED – a combination desirable in residential applications. In this case we need even more long wavelength light (600–700 nm) relative to medium and short wavelengths. To accomplish this, the peak of the phosphor has to shift farther towards the red end of the spectrum, further lowering the luminous efficacy of the LED.
The first approach can produce CRIs above 90 for 2700-3000K LEDs and still maintain high luminous efficacy. The second approach can achieve CRIs above 95, but with lower luminous efficacy than lower CRI white LEDs.
Beyond CRI
CRI as a color rendering metric has several known deficiencies. The most obvious is that it uses only eight spectral reflectance distributions (swatches) to represent the infinite number of possible spectral reflectance distributions of real objects that can be encountered in real applications. Several replacements for CRI have been proposed such as the color quality scale (CQS) by Davis and Ohno at NIST. Until CQS or another metric becomes the new color rendering standard, we are left with CRI.
The six additional swatches included in the CRI standard can be used to some degree to make up for the small number of spectral reflectance distributions used in the standard. The R9 value which is a saturated red is often of interest for white LEDs since white LEDs often do not render deep reds well due to a shortage of light at long wavelengths. Comparing the R9 values of two LEDs in addition to comparing their CRI values can be instructive, especially for applications where the color rendering of red is important.
There are also applications where a CRI approaching 100 may not be desirable. This may even be the case in residential, retail and restaurant lighting where high CRI is assumed to be essential.
For instance, in some situations you may want LED lighting that increases the saturation of colors. CRI does not discriminate between color rendering shifts that make colors appear more desaturated or more saturated. All color differences between the test and reference sources are treated equally. It is well known that in digital photography we prefer photos with more saturated colors. It is rather standard practice today to increase the color saturation of digital photos using image processing software.
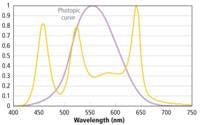
Increasing color saturation This fact suggests that we may prefer lighting that increases color saturation. By enhancing the amount of light at key wavelengths in the sources’ SPDs, we could increase the color saturation or chroma of specific colors and in the process reduce the CRI. With LEDs, this is easy to imagine. If we wanted to enhance the primary colors we could mix in additional red, green and blue light from red, green and blue LEDs along with a typical white LED (Fig. 7).In the example in Fig. 7, red, green and blue LEDs are added to the warm white LED depicted in Fig. 6, resulting in a 5500K CCT with a CRI of 81. Although the CRI drops significantly it does so because the saturation of the color swatches in the CRI calculation increases with the exception of swatches TCS02 (yellow) and TCS06 (light blue). The saturation of both of these swatches remains largely unchanged. These results only apply to the particular swatches use in the CRI calculations. It is practically impossible to predict how swatches with different spectral-reflectance characteristics would render when illuminated by such a light.
Similarly, it may be possible to alter the SPD of LED lights in such a way to enhance the appearance of specific items such as food in restaurants and in grocery stores. LED technology gives us the tools for the first time to tailor the SPD of light sources at least to some degree. How this flexibility is used in new applications over the next few years will be exciting to watch.
The tradeoff between CRI and luminous efficacy is currently a major focus in the industry. As LED luminous efficacies continue to improve, LEDs will enjoy an even greater competitive advantage over competing technologies such as CFLs. At that point the marginal return of further increasing LED luminous efficacy will make trading some of that efficiency off for higher CRI a more attractive option. Phosphor technology should also continue to improve, reducing the need to tradeoff luminous efficacy for higher CRI.
Sidebar: Calculating CRI
The CRI of a light source is calculated by comparing the chromaticity coordinates of eight standard patches or color swatches when illuminated by the light source in question (the test source) and by a reference light source. The test patches are not actually illuminated by either the test or the reference source. Instead the chromaticity coordinates of the light that would be reflected off of each patch by each sources is calculated by multiplying the SPDs of each source by the spectral reflectance distributions of each patch. The spectral reflectance distributions of the eight patches were chosen to be representative of common materials. The metric used to quantify the color differences under the test and reference light sources is the Euclidean distance in the CIE 1964 color space, ΔΕCIEUVW, with chromaticity coordinates, U′, V′, and W′. An additional six patches are also tested individually and reported separately, providing supplemental color rendering information for those colors.
The steps in calculating the CRI of a source from its SPD are as follows:
• Determine the CCT of the test source.
• Generate the SPD of the reference source.
• If the CCT of the test source is less than 5000K then use the SPD of a blackbody radiator with the same CCT as the test source.
• If the CCT of the test source is greater than 5000K, use the SPD standard illuminant D with the same CCT as the test source.
• Calculate the SPD of the reflected light for each of the eight spectral reflectance distributions of the color swatches for both the test and reference sources. This is done by multiplying the SPD of each source by the spectral reflectance of each swatch on a wavelength by wavelength basis.
• Find the x, y chromaticity coordinates of the reflected light and then convert to U′, V′, and W′ chromaticity coordinates of the CIE 1964 color standard.
• Apply a “von Kriess transform” to the U′, V′, and W′ values to account for chromatic adaptation by the human visual system.
• Calculate the ΔΕi = ΔECIEUVW color differences between the test and reference sources for each color patch.
• Calculate the specific color rendering index for each patch by, Rі = 100 - 4.6ΔΕі
• Average the eight Ri values to arrive at Ra, which is the CRI value for the test source.
More in this series
Understand color science to maximize success with LEDs
Understand color science to maximize success with LEDs – part 2
Understand color science to maximize success with LEDs - part 3
*Updated Nov. 2, 2020 for additional content links.


