This article was published in the April/May 2012 issue of LEDs Magazine.
+++++
As LEDs continue to make inroads into general illumination, the color quality of the light LEDs produce is becoming increasingly important. This is the first in a series of articles that explore the science of color as it applies to LED technology. This article begins by explaining the origins of the CIE Chromaticity Diagram and the science that led to the CIE 1931 standard that lies behind the Chromaticity Diagram. Future articles will discuss natural and artificial light sources and their color rendering characteristic as well how to use color science to improve the color quality and color rendering characteristics of LED light sources.
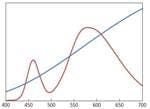
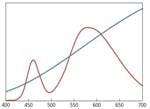
In fact, it is possible for two light sources to have the exact same chromaticity coordinates, but have very different spectral power distributions (SPD) as in Fig. 1. If we directly view the light emanating from these two light sources, they will appear to have the exact same color. If we use these light sources to illuminate colored objects, the perceived colors of the illuminated objects can vary significantly from one light source to the other. The more the SPDs of the two light sources with identical chromaticity coordinates differ, the more likely it is that the colors of objects illuminated by the two light sources will also differ.
Retina function
By now you might feel like you are reading a college freshman philosophy paper. To bring this back to reality we need to delve into how the retina actually detects light. The retina has two types of light-sensitive receptors called rods and cones. Cones are responsible for color vision and high resolution vision, while rods which are much more sensitive to light than cones and have no effect on color vision. Rods are responsible for night or low-light vision and for motion detection primarily in the periphery.
There are three varieties of cone receptors, each with their own range of spectral sensitivity curves that overlap each other, but are yet distinct. Fig. 2 plots the spectral response of each of the cone receptors. Although the spectral response of each cone type correlates roughly with the colors red, green and blue, visual psychologists prefer to call them “L”, “M” and “S” cones, which stand for long, medium and short wavelengths respectively. The relative ratio of the response of these three cone receptors to a given SPD determines the color we perceive.
We can understand this better by examining the details of Fig. 2, which also shows the colors associated with each wavelength. At the shortest wavelengths when only the S cones are being stimulated we see the color violet. As the wavelength increases the M cones start to respond in addition to the S cones and violet turns to a deep blue. As the response of the M cones increases further relative to the S cones the color perceived shifts to a greenish-blue, then to a bluish-green and finally to a pure green when the ratio of the M cones to the L and S cones is at its highest.
Combining cone response
The neural signals leaving the cones undergo further processing before entering the optic nerve for transmission to the visual cortex at the back of the brain. The L, M and S responses are combined into three channels, one that encodes brightness (intensity or luminance) information and two that encode for color. Fig. 3 is a schematic representation of this processing. There is still some debate about the exact nature of this encoding, but there is general agreement on the broad picture. The L and M channels are added together in a weighted average to produce the luminance signal. The S cones contribute little and possibly nothing to the luminance channel.
The combined response of the cones that constitutes the luminance channel results in the well-known photopic curve, V(λ) under daylight conditions. Under nighttime illumination levels the cones are too insensitive and contribute little to vision. The rod cells which are much more sensitive than cones take over and dominate. Rod cell contribution to the luminance channel is characterized by the scotopic curve designated by V’(λ). All photometric measurements such as intensity (candelas), flux (lumens), illuminance (lux) or luminance (nits) use either the V(λ) or V’(λ) curves (depending on illumination level) to weight the SPD of the light being measured. Photometric flux for instance is calculated by integrating the SPD weighted wavelength by wavelength by the V(λ) curve over the visible spectrum.
So far we have only discussed the eye’s response to single wavelengths. What happens when light is broadband rather than a single wavelength? In the case of broadband light falling on the retina, the response of each cone type is the integral of the SPD of the light source multiplied by the spectral response of each cone on a wavelength by wavelength basis. For these detailed calculations see the sidebar, “Calculating cone response curves.”
SPD of a source
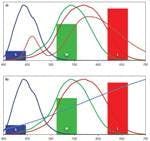
Fig. 4a shows the SPD of a typical warm white, 3000K LED superimposed on the cone response curves, along with a bar chart showing the resulting response of each cone type to the LED’s SPD. Likewise, Fig. 4b shows the cone response to an incandescent bulb at 3000K. Note that the cone response for both the LED and the incandescent bulb are identical even though their SPDs are very different. These two light sources will look the same color because the cones respond identically to each of them. Two light sources with differing SPDs, but which nonetheless appear the same color are called metamers.
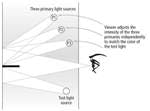
As you might imagine it is not a simple task to find the right combinations of the three LCD primaries to create a metamer for a known SPD. The history of color science is essentially the history of solving this problem. In the early days of color science at the beginning of the 20th century, the spectral response of the cones was not known. In fact, the number of cone types was not known, but was assumed to be three because three additive or three subtractive colors are all that are necessary to mix all of the basic colors. The first step in the process was to characterize the spectral response of the eye.
Color space transforms
The results of color matching experiments are three curves or functions, which show the relative intensity of each primary required to match the color of a light of a single wavelength over the visible range of wavelengths. If the primaries are changed to a different set of monochromatic sources, then the experiment results in a different set of color matching functions. We will refer to a set of color matching functions from a given color matching experiment as a CMF. How are two CMFs from experiments with different primaries related to each other? It turns out that all CMFs are related to each other by a linear transformation. The below equation represents such a linear transformation in matrix form. It transforms the CMF consisting of a(λ), b(λ) and c(λ) into a new CMF, a’(λ), b’(λ), c’(λ).
The CIE 1931 standard is just one of an endless number of possible color spaces, all of which can be derived from any other set of color matching curves with a linear transformation. The CIE 1931 standard was derived from data from two independent color matching experiments performed by W David Wright and John Guild in the 1920s. Each of these color matching functions were transformed into a new color space that corresponded to a different set of idealized primaries. The results after the transformation were nearly identical for both Wright and Guild’s data as would be expected because as stated above all color matching functions are linear transformation of each other. The differences were due to experimental error and natural variability amongst the observers participating in the experiment.
Two-coordinate color
The simplicity of identifying a color with just two numbers makes the CIE Chromaticity Diagram a very useful tool for specifying the color of an LED in a universal standardized way across the industry. More importantly though by studying the origins of the CIE 1931 standard we gained a better understanding of the science underlying color vision. In the process three fundamental concepts of color were introduced that provide powerful insights into how we see color. These three concepts are 1) that color can be explained by the relative cone responses, 2) metamers and 3) all color matching functions are linear transformations of each other. When these concepts are properly understood they can be applied to great effect to a wide variety of problems facing the LED engineer. In future issues of LEDs Magazine we will exploit these three concepts and the CIE 1931 standard to explore current hot topics in the LED industry relating to color, such as color rendering and color mixing.
More in this series
Understand color science to maximize success with LEDs – part 2
Understand color science to maximize success with LEDs - part 3
Understand color science to maximize success with LEDs – part 4
*Updated Nov. 2, 2020 for additional content links.
