Understand luminous and radiant intensity, and uniformity characterization (MAGAZINE)
In this excerpt from a reference book entitled Handbook of LED and SSL Metrology, GÜNTHER LESCHHORN and RICHARD YOUNG explain the fundamentals behind luminous and radiant intensity measurements and how to characterize uniformity and glare.
In the October issue of LEDs Magazine, the article "Understand how to measure luminous flux and radiant power" covered some of the basics of metrology for the solid-state lighting (SSL) industry. This article continues the metrology theme, covering luminous and radiant intensity measurements and providing a discussion of uniformity and glare. The prior article and this article have been excepted from a chapter of the newly-published Handbook of LED and SSL Metrology reference book.
Interested in articles & announcements on SSL performance & testing?
Luminous intensity and radiant intensity
Luminous intensity is the most frequently measured parameter for low power LEDs. According to the definition, luminous intensity must be measured at a distance where the sample can be considered as an approximated point light source. The distance of the detector from the test specimen required for conformity with this criterion is known as the photometric distance. It varies with the size of the light source to be measured. The minimum factor, given by the ratio of the distance to the detector and the maximum extent of the light emitting surface, varies between 5 and 15 depending on the applied standard and the prevailing spatial radiation pattern.
One method of determining luminous intensity Iv involves calibrating the detector in illuminance Ev and calculating luminous intensity using the inverse square law:
Ev = Iv/r2
Apart from maintaining the far-field condition, the validity of this calculation requires the precise measurement of the distance r between the detector and LED. The many different designs available make it difficult to determine the precise position of the emission center (also known as the goniometric centroid) of the LED.
The "averaged LED intensity" concept
Many LEDs have a relatively large emitting area compared to the short distance that is generally used for a measurement. Lenses, if present, may dramatically shift the apparent position of the emitting center. A point source cannot be assumed and therefore the inverse square law no longer holds. The irradiance measured at the detector is not easily related to the intensity of the source. Therefore, measurements done with different geometrical setups will most likely lead to different results and are difficult to compare.
Because of this, the CIE developed the concept of "averaged LED intensity" to solve the problem that occurs under near-field conditions. This concept no longer corresponds to the physically precise definition of luminous intensity but relates more to a measurement of illuminance at a fixed distance and detector size. The LED is positioned in such a way that its mechanical axis is directly in line with the center point of a round detector with an active area of 1 cm2, and the surface of the detector is perpendicular to this axis.
The CIE gives two recommendations for the distance between the LED and the detector surface (see table). Condition B is the most commonly used geometry since it is also suitable for weak LED light sources. The front tip of the LED is always taken as the reference point for the distance. This guarantees that the same geometry is always used when measuring luminous intensity in different laboratories irrespective of the design of the LED.
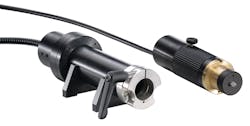
Fig. 1 shows the realization of this concept in practice. The intensity probe comprises a tube with a length corresponding to the desired CIE condition into which an LED test socket can be inserted. The distance between the tip of the LED and the detector is exactly 100 mm in the case shown in Fig. 1. Two baffles in the beam path help to reduce stray light. A fiber bundle is located behind the diffuser to guide the light into a calibrated spectroradiometer.
The "partial LED flux" concept
Sometimes neither the luminous intensity nor the luminous flux represent the usable light for a particular application and something in between is required. The quantity of partial LED flux was introduced in CIE publication 127-2007.
Luminous intensity involves a flux and a solid angle and is the ratio of the two; hence its unit is the candela which is the lumens per steradian. Partial LED luminous flux also involves a flux and an angle but is expressed as the flux within the angle as opposed to a ratio; hence its unit is lumens (with the angle specified).
Like averaged LED luminous intensity, it is a near-field measure and hence is similarly defined in terms of physical geometry rather than being a fundamental unit. This is why the term "LED" is included in the quantity. This distinguishes it from the partial flux that may be calculated from far-field goniometric measurements.
Distance d is set for a desired half cone angle x as given by
d = 25/tanx/2[mm]
where 0°≤ x ≤180°
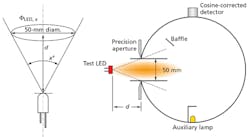
The symbol for this quantity is ΦLED,x, with the value of x being the cone angle (diameter) in degrees. For example, ΦLED,180 is the flux emitted in the front half hemisphere (forward flux) in which case, d = 0. Any flux emitted in the directions other than in the given cone angle is ignored. Fig. 2 left shows the basic concept.
The reference point of the LED is the tip of the enclosure of the LED, though it may not be the effective center of light emission, because it can be easily identified for any type of LED while the effective center of emission is difficult to determine and sometimes unknown. It is chosen for simplicity and reproducibility of measurement. The diameter of the aperture (50 mm) is fixed in order to achieve reproducibility in measurement. As this is a near-field measurement, results would vary if apertures of different sizes were used for the same cone angle.
For the measurement of partial LED flux, an integrating sphere with for example 250 mm in diameter can feature an input port with a precision aperture of 50 mm in diameter (see Fig. 2 right). By varying the distance d, different cone angles can be realized and measured.
Although the unit of partial LED luminous flux is the lumen and hence the same as the total luminous flux, the quantities are different and should not be confused. Total luminous flux is a measure of all the light emitted by the LED, whether 2π or 4π. Partial LED flux is the flux within a set measurement geometry and hence may be all or a fraction of the total flux emitted depending on the LED radiation pattern. Care should therefore be exercised in comparing partial LED fluxes to ensure the same cone angle, x, is used and is appropriate for the application.
Spatial radiation characteristics of LEDs
The many different packages and types of LEDs generate different spatial radiation characteristics. Precise knowledge of the angle-dependent distribution of radiation is necessary for some applications. For example, a full-color (red, green, blue) LED display may appear white when observed at a normal angle if all three colors are illuminated simultaneously. However, if the LEDs have a different spatial distribution of radiation for the individual colors, a color change occurs when the display is observed off axis.
Luminous intensity distributions
Characterizing luminous intensity distributions of LEDs and SSL sources is a pure photometric measurement task that can be performed by a goniometer unit used together with a spectroradiometer or photometer. A photometer allows very fast "on-the-fly" measurements and is recommended for pure photometric measurements and for time critical test sequences. Spectroradiometers offer the distinct advantage that all characteristics - radiometric, colorimetric and photometric - can be determined with maximum precision. Nevertheless, goniospectroradiometers have longer measurement times.
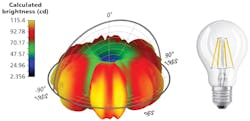
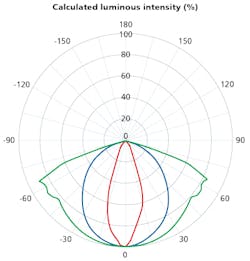
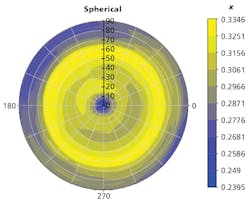
Luminous intensity is measured in the far-field (maintaining the photometric distance) for different azimuth and elevation angles. Using a C,γ coordinate system leads to a complete spatial radiation pattern of luminous intensity (luminous intensity distribution). As an example, refer to the luminous intensity distribution in 3D representation of a filament LED bulb (Fig. 3). A single profile generated by scanning the γ angle is also known as a luminous intensity distribution curve of a single C-plane. An example of different luminous intensity distribution curves gives the radial plot of Fig. 4. A source with near-lambertian distribution (blue curve), a narrow-angled source (red-curve) and a LED with distinct intensity shape for special applications (green curve) are shown. In general, different display options for spatial radiation patterns like radial, semi-radial, Cartesian, spherical and 3D are common and used for data evaluation.
The data generated in goniophotometry can be used in lighting simulation programs. Lighting fixture manufacturers and others are using two different types of file format for specification of luminaire photometry, especially luminous intensity distributions from light sources. One is the Illuminating Engineering Society (IES) standard and the other is the EULUMDAT data file format. The file extensions are .ldt and .ies. The IES standard is defined in the document LM-63-02. The EULUMDAT format is the European equivalent to the IES file format.
Colorimetric spatial radiation patterns
Colorimetric spatial radiation characteristics can only be measured using a goniospectroradiometer (or a gonio-colorimeter but this filter based method is not recommended for absolute measurement of color quantities). With a goniospectroradiometer, all relevant color information such as color coordinates, dominant wavelength, color temperature, color rendering index, etc. can be recorded simultaneously in an angular resolved measurement. Analyzing a potential angular variation of colorimetric quantities is important for LED manufacturers as well as for module and luminaire manufacturers. For example, the color coordinates of a white LED often show a significant blue shift because the light path through the yellow phosphor is angle dependent (see Fig. 5).
Significant variations of correlated color temperature with angle can be observed for LED modules. Fig. 6 shows CCT variations with angle for a LED module in 3D representation and the angular profile in a Cartesian plot.
Typical measurement times
The measurement of angular resolved photometric or colorimetric distributions is time consuming. The measurement time highly depends on the details of the measurement. The type of detector used, the characteristics of the sample and the anticipated resolution contribute to the time a user has to invest. Although it is impossible to give a reliable answer to the question of measurement time for all cases, typical times can be estimated. The basic idea is to analyze the behavior of two typical sources. One with a broad, and one with a narrow luminous intensity distribution.
To cover the contribution of the detector, both sources are measured using a photometer, a spectroradiometer with fixed integration time and a spectroradiometer in autoranging mode. The fixed integration time is set by adjusting the spectroradiometer near saturation at the angle with highest signal level. The autoranging measurement will adjust the integration time of the spectroradiometer automatically during the angular scan (each change in integration time must follow a dark current measurement). Obviously, this procedure is the slowest.
To cover the aspect of anticipated resolution, the deviation of the measurement result to the "real" value of luminous flux is evaluated for measurements using different angular increments.
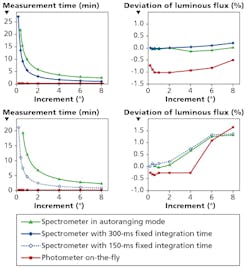
The results are summarized in Fig. 7. The upper half and the lower half of the figure correspond to a single C-plane scan of samples having a broad and a narrow angular distribution, respectively. The left side shows the measurement time in minutes versus the used angular increment. An on-the-fly measurement is obviously the fastest measurement and with approximately 15 seconds per C-plane nearly independent of the used resolution. Both measurements with the spectroradiometer (fixed integration time and autoranging) show a similar behavior. The measurement time rises steeply approaching a finer resolution. From these measurements recommendations for the anticipated resolution and also an estimation of measurement time can be given. Since a narrow angular distribution leads to a rise in the deviation of luminous flux with increments >2°-3°, a scanning increment of approximately 2° is the optimum choice. If the task is to measure such a source with a spectroradiometer, the recommendation would be to use a fixed integration time (the deviation is nearly the same for fixed integration time and for autoranging). From the lower left plot in Fig. 7, one can estimate a measurement time of 2.5 minutes per C-plane for this increment. A measurement of 16 C-planes in this configuration would therefore last approximately 40 minutes.
Uniformity and glare
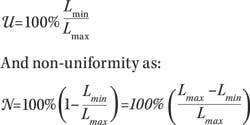
The definition of luminance uniformity (or non-uniformity) often depends on application. For displays, uniformity with respect to position on the display and angle to the display are required. In general uniformity is defined as:
For SSL general lighting, the uniformity of irradiance is important but often the luminance uniformity is not considered. This is changing, with several groups working on definitions of uniformity that can be generally applied. However, the above definition is inadequate as the locations of Lmin and Lmax are irrelevant. This means that the panels in Fig. 8 have the same uniformity because they have the same Lmin and Lmax.
Clearly, the eye perceives these as different uniformity because it is sensitive to the rate of change of luminance and not just their absolute values. Several possible methods for describing uniformity based on frequency or values over a specific pattern are currently under discussion but none are standard as yet.
Glare
When bright sources such as the sun or its reflections in water are in a person's field of view, they can affect their ability to see the other details of a scene. Glare is generally divided into two types: disability glare and discomfort glare.
Disability glare is the reduction in visibility caused by intense light sources in the field of view but is not necessarily uncomfortable. In fact, some lighting designs deliberately create disability glare to add "sparkle" to a scene.
Discomfort glare is the sensation of annoyance or even pain induced by excessively bright sources. Both types of glare are subjective and vary from person to person. However, there is a general increase in sensitivity to glare with age.
For indoor sources the most commonly employed measure of discomfort glare is the CIE unified glare rating, UGR. It is defined as:
• Where Lb is the background luminance [cd/m2].
• L is the luminance [cd/m2] of the luminous parts of each luminaire in the direction of the observer's eye.
• ω is the solid angle [sr] of the luminous parts or each luminaire at the observer's eye.
• p is the Guth position index (displacement from the line of sight) for each luminaire.
ACKNOWLEDGMENT
The complete Handbook of LED and SSL Metrology is available under the following ISBN numbers: ISBN 978-3-86460-643-4 (paperback, EUR 40), ISBN 978-3-86460-644-1 (hardcover, EUR 78) or ISBN 978-3-86460-917-6 (e-book, EUR 39.99). More information at www.instrumentsystems.com/handbook.
GÜNTHER LESCHHORN is head of product management at Instrument Systems (instrumentsystems.com). RICHARD YOUNG recently retired from his role of chief scientist and is now working as a consultant for Instrument Systems.





![The DesignLights Consortium continues to make progress in shifting outdoor lighting products and implementation practices toward a more restrained and thoughtful strategy. [Image does not represent a DLC qualified fixture.] The DesignLights Consortium continues to make progress in shifting outdoor lighting products and implementation practices toward a more restrained and thoughtful strategy. [Image does not represent a DLC qualified fixture.]](https://img.ledsmagazine.com/files/base/ebm/leds/image/2024/08/66be810888ae93f656446f61-dreamstime_m_265700653.png?auto=format,compress&fit=&q=45&h=139&height=139&w=250&width=250)
