Understand color science to maximize success with LEDs - part 3 (MAGAZINE)(UPDATED)
This article was published in the October 2012 issue of LEDs Magazine.
+++++
LED-based lighting is certainly a growth industry, but also one in which we are still learning how to employ solid-state lighting (SSL) technology to deliver optimal light quality along with the expected benefits of lower power consumption. If you understand color science, and the capabilities of mixing LED color, however, you can design products that deliver on the seemingly opposing goals of quality and efficiency.
In the second article we used these principles to explain the origins and uses of the CIE Color Diagram including predicting the color coordinates in the CIE Color Diagram for mixtures of colors. We also discussed the origins of the Planckian locus, a curve through the center of the CIE Diagram which plots the color coordinates of a particular type of white light sources known as blackbody radiators. Blackbody radiators emit light due to their high temperature. The location along this curve depends on the temperature of the object. From this we explained why LED manufacturers design their white LEDs to have color coordinates that fall as close as possible to the Planckian locus.
In this article we build upon this knowledge to show how to design LED illumination devices that mix the light from different color temperature white LEDs and from colored LEDs to achieve results not possible with white LEDs of the same color temperature alone. In the first example we will show how to make a white LED source with a tunable color temperature. In the second example we will improve upon this type of source by adding a third non-white LED.
CCT tunable lamp
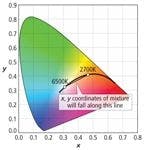
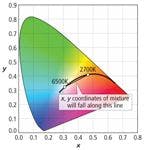
Unlike both sunlight and incandescent light bulbs, LEDs have a fixed color temperature. To make an LED source that mimics sunlight as it changes color temperature throughout the day or an incandescent bulb as it is dimmed, we have to mix together the light from two or more different color temperature LEDs. We learned in the previous article that the chromaticity coordinates of a mixture of two colors will fall on a line in the CIE Diagram between the chromaticity coordinates of the two colors being mixed. Since the Planckian locus is a curve and not a straight line, a two LED mix will only approximate the Planckian locus for a relatively short span of the locus. Fortunately the region from 2700K to 6500K can be approximated quite well with a straight line between x = 0.464, y = 0.409 (~2700 K) and x = 0.312, y = 0.323 (~6500 K) (Fig. 1).
The issue to address is how we determine the relative brightness of each LED that is required to move along the line between 6500K and 2700K. The problem is trivial if we simply want to have a control knob that varies the color temperature by simply increasing the brightness of one LED while decreasing the brightness of the other LED as the control knob is turned. If, on the other hand, we want to choose a specific target color temperature, then the problem gets more complicated.
First we need to determine the chromaticity coordinates of the target color temperature. There are two ways to do this: 1) Create a look up table using Planck’s Law, or 2) Approximate the Planckian locus with two polynomials, one for x as a function of temperature, T and the other for y as a function of x. This is possible because the x value of the Planckian locus decreases monotonically as a function of T. In other words there is only one value of x for every value of T on the Planckian locus. This is not the case for y. Even so there is only one value of y for every value of x along the Planckian locus. The polynomials below were fit to the Planckian locus in using a curve fitting function in a spreadsheet.
Once we have the chromaticity coordinates of the desired color temperature, we need to calculate the relative brightness of the two sources required to achieve these chromaticity coordinates. In part 2 of this series we presented two equations for finding the chromaticity coordinates of a mixture of two LEDs given their relative brightness k1 and k2 and the x, y coordinates of each LED. The equation to find the x coordinate of the mixture, is:
We also can apply the condition that the relative brightness of each LED sums to 1 resulting in:
If we treat these two equations as a linear system, then we can solve for k1 and k2 given xm and the chromaticity coordinates of the two LEDs.
The majority of the terms in the first equations can be calculated in advance. Only the terms that include xm need to be calculated for a new target color temperature, T. This means that for each time k1 and k2 need to be found for a new T, the calculation will involve two multiplication, two addition, and one division operations. This is not too difficult to perform in a microcontroller, but could easily be converted into a look-up table to simplify the task.
Adapting to LEDs
This all looks rather straightforward until we consider that it is impossible to buy LEDs with exact chromaticity coordinates. LED manufacturers sell LEDs in chromaticity bins and generally will not sell just one bin, but a grouping of bins. This inherent variability in the chromaticity coordinates of the two LEDs used to create the new mixture will result in a corresponding variability in the chromaticity coordinates of the mixture. We can use what we have learned to date to put bounds on this error.
If this degree of error is unacceptable there are two basic ways to reduce the error. One way is to calibrate each light during manufacturing by measuring the exact chromaticity coordinates of the LEDs in the light and then storing those values in a non-volatile memory for use in calculating k1 and k2. This method is obviously expensive and it cannot correct for shifts in the LEDs chromaticity coordinates as the LEDs heat up or age. The second approach is to add a color sensor and use it in a feedback loop to calculate the relative brightness of each LED to achieve the desired mixture. In the next example we will explore this approach while adding a third LED.
Three LED CCT tunable white lamp
Adding a color sensor for feedback can solve a number of problems. First of all there is no need for matching chromaticity bins of the cool and warm white LED pairs. In fact the use of feedback from an accurate color sensor can reduce the chromaticity error of the mixture to a fraction of the size of the LED’s chromaticity bins themselves. A sensor can also compensate for changes in the chromaticity coordinates of the LEDs as they warm up on startup or as they age throughout their lifetime.
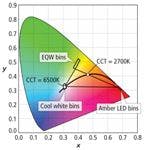
In this example we will use Osram's Brilliant Mix technology. Brilliant Mix is a two LED mixture of an amber LED and a greenish white LED Osram calls EQ White, to achieve a high luminous efficacy white mixture at warm white CCTs and with excellent color rendering index (CRI). In conventional white LEDs, the luminous efficacy of the LED drops as the color temperature is reduced. The reason for this is that the phosphors required to produce a spectral power distribution (SPD) with high power on the red end of the spectrum required for a lower color temperature also produce red light at wavelengths above 650 nm where the eye’s sensitivity falls off dramatically.
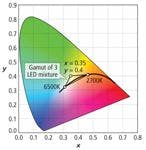
Brilliant Mix solves this dilemma by using an amber LED with a peak wavelength of 625 nm to increase the SPD of the mixture at the red end of the spectrum without requiring an inefficient phosphor which produces excess power above 650 nm. The EQ White LEDs use a phosphor that peaks around 550 nm, which also happens to be very near the peak of the V(λ) curve so the EQ White LEDs have a very high luminous efficacy. With the addition of a third cool white LED to the red and EQ White LEDs of Brilliant Mix a CCT tunable white lamp with high luminous efficacy and high CRI can be achieved (see the gamut of the three LEDs in Fig. 4).
Color sensors adds fidelity
There are at least two ways to use a color sensor to control the chromaticity coordinates of the mixture. The first method is to measure the exact chromaticity coordinates of each LED and then compute the brightness of each LED to achieve the desired chromaticity coordinates. To measure the chromaticity of each LED independently means that each LED must be on while the other two are off. The issue here is how to do this without it being noticeable. This could be done at startup, but then any shift in color as the LEDs come up to temperature will not be taken to account. It could also be done periodically as the light is on by cycling through the LEDs in rapid succession. If done quickly enough the eye will average the colors together and it will not be noticeable that the individual LEDs are on one at a time. This cycling only needs to be done once every 10 seconds or so minimizing the chance of the cycling being noticed.
In either method we require a color sensor that can be calibrated to output accurate color measurements. There are several good color sensors to choose from. We also have a choice of working in CIE chromaticity coordinates or in tristimulus values. The calculation of the relative brightness of each LED is simpler mathematically using tristimulus values, but then we need to convert the target chromaticity coordinates to XYZ tristimulus vales (see part 1 of this series, for an explanation on converting from chromaticity coordinates to tristimulus values).
One solution is to use a color sensor that outputs tristimulus values directly such as MAZeT’s MTCSiCS color sensor. There are also several RGB sensors commercially available, which have three different sensor types that roughly correlate to red, green and blue. Examples include Maxim’s MAX4406/MAX44008 or Intersil’s ISL29120. These sensors use absorption filters similar to the ones used in the CCD and CMOS image sensor of digital cameras.
To understand how to calibrate an RGB sensor to effectively output tristimulus values, we can make use of the third fundamental principle of color science discussed in this series – that all color-matching functions are linear transformations of each other. The CIE color-matching functions from which we obtain the CIE XYZ tristimulus values are just one such color-matching function. If the wavelength sensitivity curves of an RGB color sensor just happen to be color-matching functions, then a simple linear transformation will convert these curves to the CIE color-matching functions. Applying such a transformation to convert the RGB output values of a color sensor to XYZ tristimulus values is equivalent mathematically to transforming the wavelength sensitivity curves of the sensor into the CIE color-matching functions.
While it is a theoretical possibility that the wavelength sensitivity curves of any given RGB sensors are actually color-matching functions, the chances of this being the case are practically zero. Fortunately, the wavelength sensitivity curves only need to be close to true color-matching functions to be useful for our purposes. One way to find out how close the RGB sensitivity curves of a particular color sensor are to a true color-matching function, is to find the linear transformation which when applied to the RGB wavelength sensitivity curves results in the closest match possible to the CIE color-matching functions.
Mathematically finding such a transformation is simpler than you might think. We’ll walk through how this is done for a hypothetical color sensor with RGB wavelength sensitivity curves typical of the sensors that are commercially available (Fig. 5). In this example we will use a transformation that uses the R,G,B outputs plus higher order terms:
In this case the resulting transformation is:
Using M to transform the sensors wavelength sensitivity curves into the CIE color matching functions gives interesting results (Fig. 6). While the match is far from perfect, the transformed curves match the CIE color matching functions reasonably well. The resulting error in tristimulus values for a typical 5000K LED is -0.005 in x and -0.01 in y.
A calibrated color sensor is the last piece in the puzzle. Given a target color temperature, the x and y color coordinates can be calculated and then converted to target tristimulus values. The current tristimulus values of the three LEDs can be measured with the calibrated color sensor and then the relative brightness of each LED required to achieve the target tristimulus values is just the weighted sum of the measured tristimulus values of the three LEDs that match the target tristimulus values. The brightness of each LED can then be adjusted using either pulse width modulation (PWM) or by adjusting the forward current of the LEDs. Typically PWM is superior to using forward current to control LED brightness, because the LEDs output is not linear with current. In this case though, the color sensor is giving continuous feedback of the actual brightness of each LED and the feedback loop will null out any error caused by using forward current to set LED brightness.
While these two approaches to color mixing outlined in this article add complexity and cost to an LED product, in the right application this added expense can be worth it. The use of multiple white and colored LEDs to create LED light sources with tunable color characteristics combined with feedback from color sensors opens up new possibilities while simultaneously improving color accuracy.
More in this series
Understand color science to maximize success with LEDs
Understand color science to maximize success with LEDs – part 2
Understand color science to maximize success with LEDs – part 4
*Updated Nov. 2, 2020 for additional content links.
