JEDEC technique simplifies LED junction temperature measurement (MAGAZINE)
The leading standard for optical measurement of high-power LEDs, the CIE TC 2-63, refers to LED junction temperature 204 times. According to its authors, members of the International Commission on Illumination (CIE), this parameter directly influences the LED’s photometric, radiometric, and colorimetric performance. Junction temperature, or TJ, is also a key parameter in LED reliability performance as semiconductor, phosphor, and packaging failure mechanisms involve chemical reactions that have specific activation energy thresholds.
Because TJ is so important, luminaire designers establish a target TJ for the luminaire early in the design process. Usually the target TJ is chosen using LM-80 reliability test data supplied by the LED manufacturer. During the design validation process for the luminaire, TJ may be verified for individual LEDs in the product, but the verification methods have shortcomings, especially when applied in situ to the complete product including heat sinks, optics, and housing.
Here we describe a simpler method for measuring junction temperature that is easy to use with complete luminaires — the Electrical Test Method (ETM). The ETM is defined in JEDEC’s JESD51-51 and JESD51-14 standards; it uses the LED junction’s inherent voltage-temperature relationship to infer TJ. Using the ETM, luminaire designers can measure individual LED junction temperatures, as well as the ensemble junction temperature — that is, the temperature of the LED circuit treated as one virtual device.
Why TJ matters
LED optical parameters are strongly influenced by temperature. For example, LED efficiency decreases with increased junction temperature due to temperature-dependent carrier loss and non-radiative recombination within the semiconductor. The resulting decline in overall performance can be profound — for example, the luminous flux output of typical amber LEDs constructed with aluminum indium gallium phosphide (AlInGaP) material declines 1.5%/°C. LED dominant wavelength and chromaticity also shift with junction temperature.
To ensure that light output and quality are within design specifications, it is important to know the maximum and minimum LED junction temperatures. For example, if a heatsink design results in one portion of the LED circuit running hotter than another, those two sections of the luminaire could produce light at two different chromaticity values.
Junction temperature variations in time are also important because they indicate the mechanical stress that the LED and its attachment (often solder) are subjected to during the luminaire’s on-off power cycles. A wider temperature swing produces more mechanical stress, which can lead to solder migration and early failure of joints.
LED temperature is correlated with LED reliability, as shown in LM-80 and TM-21 design data. To ensure that the LM-80 data remains valid, every LED in the luminaire should operate below the temperature defined in the LM-80 and TM-21 data.
Common methods are difficult to apply
LM-80 uses case temperature (Ts) measurements that reflect the LED temperature at a specific attachment point, such as an electrical pad. In manufacturers’ LM-80 lumen maintenance tests, LED samples are powered for long periods in chambers maintained at elevated temperatures. Optical performance is measured, and drive current and Ts is reported as the stress level correlated to that optical performance. Theoretically, it is then a simple matter to replicate the same performance in a luminaire designed with the same parts, if the drive current and temperature match. In practice, it is difficult to measure the Ts once the LEDs are packaged into a complete luminaire, because the Ts point is usually inaccessible. Even if it can be accessed, attaching thermocouples or other sensors to that point can lead to heat being conducted away from or toward the LED, often rendering the results meaningless.
If a reasonable Ts measurement can be made, TJ can be calculated using the manufacturer’s specified thermal-resistance (RΘ) value. However, published RΘ values are typical values; in many cases, they depend upon a thermal path through a solder connection. But individual solder connections vary, and so it is possible to have voids and other defects in the solder connecting the LED to the printed circuit board (PCB) that increase the RΘ. When this happens, the actual TJ value can be well above the calculated value.
Other measurement tools are, for one reason or another, inadequate. Infrared (IR) cameras, for example, are sometimes used to measure the temperature of the LED but are often of limited use because the image resolution is too coarse to distinguish the LED junction from surrounding elements. In addition, many luminaires include optics such as diffuser lenses that can block access to the individual LED chips, making it impossible to accurately measure the luminaire in its true condition. Sophisticated thermal-impedance analyzers are good at determining detailed characteristics of single LEDs, but they are complex and difficult to use. In addition, they often lack the power to drive a complete luminaire.
ETM offers a better way
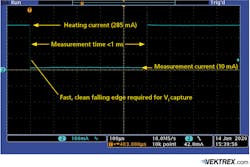
JEDEC’s ETM allows TJ to be measured in situ at full current under actual operating conditions. It uses a two-step process. First, the LED’s forward voltage versus temperature characteristic is profiled. A small DC current called the measurement current, or IM, is used for this step. IM is chosen to be high enough to light up the LED but not high enough to produce significant heating. After characterization, the LED is driven at a much higher heating current, or IH — typically the intended operating current. IH is maintained long enough to stabilize the LED at its operating temperature. After stabilization, the current is briefly pulsed down to the IM level and forward-voltage (Vf) samples are taken. See an example ETM current waveform in Fig. 1.
The voltage samples are then graphed, and the waveform is extrapolated back to T0, the time when the current switched from the heating current to the measurement current.
The resulting T0 intercept-voltage value represents the forward voltage of the LED at the moment current was reduced. This Vf at T0 is then compared with the temperature-characterization data to determine the junction temperature.
The ETM requires several high-performance components:
- A powerful current source that can drive the luminaire at full operating current and voltage
- An accurate low-current source that can provide the measurement current
- Fast circuitry to switch between the sources or fast pulsing capability
- A high-bandwidth digitizer to capture the voltage during the measurement interval
A few precision pulsed source/measure instruments (SMUs) have all the required ETM capabilities in one tool.
- Fast pulsing to handle the sharp transition required from the heating to measurement current levels
- Continuous power conversion to support the high duty cycle of the heating current waveform
- A high-bandwidth digitizer with high voltage capability to support ensemble TJ measurement
- Semi-automated software that captures the Vf trend and extrapolates it
ETM example: Feit ceiling can light
A residential can-light example illustrates how the ETM is used with a typical luminaire. The luminaire uses LEDs mounted on a metal-core printed-circuit board (MCPCB) and wired in a series circuit. The LEDs are covered with a large plastic diffuser lens and are driven by a small driver circuit mounted on a second PCB. This driver circuit is sealed inside a plastic cover. The LED lens and driver board cover are cemented in place to protect the electronics from dust and for safety.
The first step is to determine the average drive current provided to the LED array by the driver circuit. If this is not already known, it can be measured using a current probe or meter. The drive current is likely to have variation or ripple. Though the ripple will cause fluctuations in junction temperature, this may be ignored, and the average current can be used as the ETM’s heating current IH. For this luminaire, the average drive current is 285 mA.
Recall that the ETM requires two current levels — the heating current (in this case, the drive current of the LED array) and a measurement current level. The measurement current is set high enough to ensure that the LED is biased well into its normal operating region but not high enough to produce significant heating. To absolutely minimize heating, it may be tempting to select a very low measurement current, but that slows the recovery from the electrical transient that occurs when switching from the heating to the measurement current. After the switch, the measurement current must discharge the parasitic capacitances in the circuit before the Vf will represent the true LED Vf. To discharge these capacitances quickly, JESD51-51 recommends a measurement current of at least 1–3% of the heating current level.
Once heating and measurement currents are determined, the LED array is calibrated to determine how Vf shifts with temperature. This can be done by placing the LED array in a temperature-controlled chamber and driving it with the DC measurement current IM. The Vf is then measured for two or more temperature points. If the LEDs share a common heat sink, the Vf characteristic may also be characterized using an IR thermometer and any heat source — even the LEDs themselves.
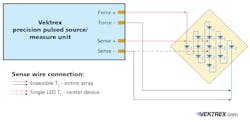
The LED circuit must be separated from the driver circuit. The array is driven by the SMU’s force terminals, while the sense terminals are connected across all the LEDs for the ensemble TJ or across a single LED for an individual TJ measurement. For best results, use twisted-pair wires for the connections (Fig. 2).
After calibration, Vf readings are taken using the two-level ETM current waveform. The electrical connections remain the same as for the calibration, but the SMU is programmed to deliver the high-duty-cycle pulsed waveform shown in Fig. 1. In this waveform, the heating current is maintained for 1s and measurement current for only 1 ms. At this duty cycle, the LEDs are operating at 99.9% of normal power.
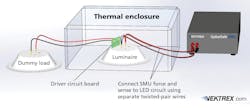
To ensure that heat from the driver circuit is also included in the test, the driver PCB is kept in place but connected to a duplicate dummy LED circuit placed outside the chamber. For a true measurement of the TJ, the remainder of the housing is left in place as well. This ensures that heat flows and buildups reflect typical operation. During this portion of the ETM, the luminaire is again placed in a temperature-controlled chamber. This time the chamber is programmed to operate at the desired application-specific temperature — for example, worst-case ceiling temperature. The overall arrangement is shown in Fig. 3.
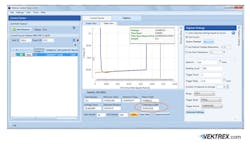
In Fig. 4, Vektrex’s Control Panel software captures the Vf waveform during the measurement interval. The captured waveform is curved, but it displays as linear when graphed on a square-root-of-time scale. Control Panel automatically calculates the y-intercept Vf corresponding to the end of the heating interval.
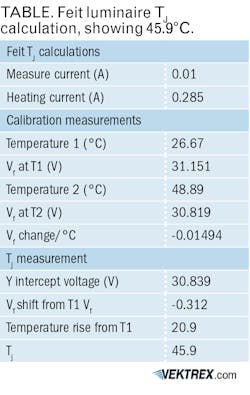
This y-intercept Vf value is then plugged into a spreadsheet, shown as the table, to calculate the luminaire TJ. For this Feit luminaire, measured with some of the housing removed, the TJ was measured at 45.9°C degrees — only about 20°C above the chamber temperature.
ETM TJ benefits
TJ testing with the ETM has many benefits. By making it possible to measure small increases or decreases in temperature, design parameters such as LED layout, heat-sink design, and thermal-interface materials can be optimized to reduce cost. Luminaire performance in actual environmental conditions can be tested, and engineering changes and design updates can be validated quantitatively, against established temperature benchmarks, to ensure product consistency.
New precision-pulsed source measure instruments simplify the TJ measurement task, making the ETM feasible for most lighting laboratories.
Get to know our expert
JEFF HULETT is the founder and CTO of San Diego-based Vektrex Electronic Systems, Inc., a manufacturer and supplier of precision pulsed current sources, and systems used worldwide for reliability test, burn-in, and photometric measurement. He is the chief designer for Vektrex’s SpikeSafe SMU source/measure product along with Vektrex's precision pulsed current source products. He has been awarded several US and international patents. Hulett is a purist, placing the highest emphasis on precise measurement science and quality. He is an active member of the Illumination Engineering Society (IES) of North America where he chairs the LM-80 working group that is focused on LED flux maintenance testing. He also participates in the IES LM-85 committee and the CIE TC2-63 committees, where he is focused on improving measurement accuracy and repeatability.


![The DesignLights Consortium continues to make progress in shifting outdoor lighting products and implementation practices toward a more restrained and thoughtful strategy. [Image does not represent a DLC qualified fixture.] The DesignLights Consortium continues to make progress in shifting outdoor lighting products and implementation practices toward a more restrained and thoughtful strategy. [Image does not represent a DLC qualified fixture.]](https://img.ledsmagazine.com/files/base/ebm/leds/image/2024/08/66be810888ae93f656446f61-dreamstime_m_265700653.png?auto=format,compress&fit=&q=45&h=139&height=139&w=250&width=250)