Ensure your light measurement method doesn't undervalue your LEDs (MAGAZINE)
The LED industry is facing a roadblock that threatens its continued rapid evolution. Heating effects are making it nearly impossible to accurately measure the performance of new LEDs. Measurements that were simple to perform with older LEDs are problematic or impossible to achieve with today's high-efficacy LEDs because the LED junction and phosphors heat significantly during the measurement. Even when the heating is minimal, heated junctions and phosphors produce less light, and the light that is emitted is shifted in peak wavelength. This fundamental measurement challenge complicates the research and development task, by making it problematic to exchange measurement data, and by making it difficult to accurately rate LEDs at their true output.
Interested in articles & announcements on light measurement?
Both the Illuminating Engineering Society of North America (IESNA) and the International Commission on Illumination (Commission International De'Leclairage - CIE) have recognized this issue. In 2014 the IESNA published LM-85, "Laboratory Method for Electrical and Photometric Measurements of High Power LEDs." LM-85 lists three different techniques for powering the LED. The techniques use DC, single pulse, or continuously pulsed current. All three tie measurements to a specific junction temperature. Tying measurements to junction temperature is a key step to ensure measurements are reproducible when performed by different laboratories or when performed using different equipment. Along the same lines, the CIE is presently developing TC2-63, "Optical Measurement of High-Power LEDs," and TC 2-64, "High Speed Testing Methods for LEDs." The CIE standards also include multiple techniques that anchor a measurement to junction temperature.
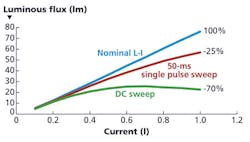
FIG. 1. The graph depicts a luminous flux versus current sweep of an Osram Golden Dragon LY W5SM AlGaInP LED showing droop caused by junction heating.
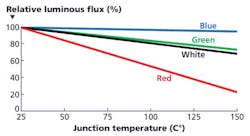
FIG. 2. LED efficiency declines as junction temperature increases, and AlGaInP and AlGaAs LEDs experience the greatest drops as data from a Cree Xlamp XM-L datasheet documents.
LM-85 improves the industry's longstanding DC and Single Pulse measurements with adjustment procedures that can compensate for the temperature rise that occurs during the measurement. However, these adjustments rely on thermal control platforms and precise timing systems that are not part of the equipment inventory in most labs. Without this high-end equipment, measurements at a specified junction temperature may not be possible or measurement repeatability may be poor.
To overcome the measurement roadblock and ensure measurement repeatability, the industry should look beyond adjusting for heating, to measurement techniques that actually minimize heating. LM-85's third method, Continuous Pulse method, accomplishes this goal. The pulse method uses low duty cycle pulse trains to power the LED during the measurement. This approach is conceptually simple, but it also relies on high-fidelity current pulses to produce accurate measurements. This article presents the best practices necessary to successfully apply the Continuous Pulse technique to make accurate LED measurements.
The problem: LED heating
The commonly used LED testing methods employ DC or DC-like current pulses to power the LED. Low efficacy LEDs are easily measured this way; however, modern LEDs operate at a much higher power density when considered relative to area or per square millimeter. At power-on, these devices heat quickly and their larger physical structures take many milliseconds to come to thermal equilibrium. At that point they need to transfer a significant amount of energy to their surroundings to remain at equilibrium. This requisite increases the demands on the thermal transfer materials and structures used to convey the heat away from the LED. If these structures are incomplete - for example, in the case of LEDs being binned at the wafer level - the heat builds up in the LED and the junction temperature increases.
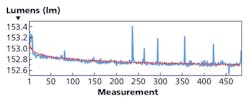
FIG. 3. LED flux measurement deviations caused by firmware-induced timing uncertainty in the source-measure instrument make it difficult to discern the actual non-linear trend line.
Flux output drop occurs because the LED's efficiency decreases as its semiconductor junction temperature increases due to drive current, as Fig. 1 shows for an Osram Golden Dragon yellow LED. This phenomenon, sometimes call droop, is due to temperature-dependent semiconductor properties such as non-radiative recombination and carrier loss. This efficiency drop can change the LED's optical output dramatically - a typical white LED output may decline 20% for a 50°C rise in junction temperature; part of this decrease is also due to a drop in phosphor conversion efficiency at high temperatures. The decline is even greater for aluminum gallium indium phosphide (AlGaInP) LEDs (red - yellow) and aluminum gallium arsenide (AlGaAs) infrared LEDs (Fig. 2).
The efficiency-drop-induced change affects some measurements more than others. Single point measurements, such as total luminous flux measurements, experience a predictable percentage error, proportional to the temperature increase. This fixed error is often ignored, but rigorous labs will account for it with a correction factor based upon the average temperature rise - for example, using LM-85's correction technique. These correction techniques work well; however, precise measurement timing is essential for repeatable measurements. In addition, this approach only works if the final junction temperature is not beyond the absolute maximum for the LED.
For multiple point measurements, such as L-I-V (luminous flux, current, voltage) sweeps, the drop-induced change is not easy to predict. This inconsistency results because the temperature rise for any point in the sweep is not just a function of that point's test conditions; it also depends on the temperature rise of previous measurements and the time delay between measurements. Indeed, the complexity means labs experience two significant measurement errors: 1) sweeps that should be linear instead exhibit an overall droop, and 2) successive measurements are not repeatable due to software or firmware-induced variations in the delay between measurement points (Fig. 3).
Vektrex and NIST tests
Indeed, Vektrex research showed usability Issues with LM-85 DC and Single Pulse adjustment techniques. Shortly after the introduction of LM-85, researchers at the National Institute of Standards (NIST) and Vektrex implemented LED tests using LM-85's techniques. Both NIST and Vektrex obtained good measurements using the techniques. However, the DC and Single Pulse adjustment techniques were sometimes difficult or impractical to implement.
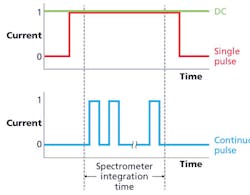
FIG. 4. In LM-85's Continuous Pulse measurement technique, the LED drive current transitions during the spectrometer integration time.
The tests required long thermal stabilization times or they required the LED mount to be maintained at temperatures close to or below 0°C. At such low temperatures, special purge gases are needed to prevent condensation and/or ice buildup in the test apparatus. Finally, the extrapolations needed for temperature adjustment required high-speed data acquisition equipment and the extrapolations were computationally complex.
Continuous pulse - Low heating solution
Vektrex found the third LM-85 measurement technique, Continuous Pulse, did not have these shortcomings. Continuous Pulse uses pulses in the microsecond range at a low duty cycle to power the LED. LM-85 recommends 50 μs. These short pulses produce little junction heating and little heat is transferred into the device - so little that equilibrium can be maintained without temperature control. Continuous pulse measurements are also computationally simple because no temperature extrapolations are needed. Measurements can be made with just a few pulses or a single pulse if the sphere is small, so this technique is suitable for production test applications.
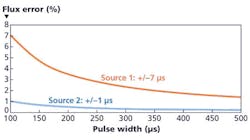
FIG. 5. The graph depicts flux error due to pulse width error versus current pulse width, when using the Continuous Pulse measurement technique; the current sources are the Source-Measure instrument (1), and the Performance Pulsed Current Source (2).
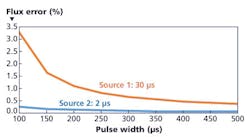
FIG. 6. The flux error due to rise time is greater at short pulse widths.
But Continuous Pulse measurements have a fundamental difference from Single Pulse and DC measurements - the LED current transitions off and on during the spectrometer's integration time. Thus the spectrometer light measurement includes light gathered when the LED is on, when it is off, and importantly, while it is transitioning between off and on (Fig. 4). This characteristic leads to pulse timing-based measurement errors that are unique to the Continuous Pulse technique. Before the Continuous Pulse technique can be used for practical measurements, these errors have to be quantified and minimized.
Continuous Pulse error and instrument timing accuracy
In fact, Continuous Pulse measurement errors originate directly from instrument timing accuracy. To understand these timing errors, consider an ideal Continuous Pulse flux measurement. Nominally no light is collected when the LED is off, so the spectrometer will report a flux value equal to the on-time flux reading multiplied by the light-on time to integration time ratio. The spectrometer's readings must be adjusted by the reciprocal of the duty cycle to obtain the true flux value as defined in the equation below.
Φtrue = Φspectrometer * tintegration-time /tlight-on
Note that the light-on time to integration time ratio refers to the light seen by the spectrometer. For classic Continuous Pulse measurements, the integration time is exactly equal to the current source pulsing period, and this ratio is the same as the current source duty cycle. However, this is simply as convention. The integration time may be different from the pulsing period.
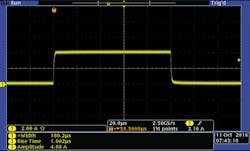
FIG. 7. The screen capture shows a near-ideal 100-μs current pulse produced by the SpikeSafe Performance Precision Pulsed current source.
The first Continuous Pulse error has to do with pulse width. Most current source instruments specify accuracy for the pulses they produce. For example, one popular source-measure instrument specifies a programming accuracy of ±5 μs and a pulsewidth jitter of ±2 μs. If this instrument is used to make a Continuous Pulse measurement using 100 μs pulses, the light-on time could be as low as 93 μs or as high as 107 μs. This translates to a ±7% flux error. This error drops to 3.5% if the pulse width is increased to 200 μs and it decreases further at even wider pulses (Fig. 5).
Error sources
Rise time error, the second pulse timing error source, is subtler but still significant. Pulsed current sources list a rise time, normally specified as the time required for the current to transition from 10% to 90%. Similarly, the fall time is the time to transition from 90% to 10%. Many factors influence rise/fall time, including the impedance of the LED, the cabling connecting the LED to the source and the source's amplifier design. If LEDs had a perfectly linear L versus I performance, rise time would not matter. But actual LEDs are more efficient at low currents. This characteristic means the sloped pulse sides contribute more flux than they should to the measurement. Like the pulsewidth error, rise time error increases with decreasing pulse width (Fig. 6).
These graphs in Figs. 5 and 6 show that the timing accuracy of traditional source-measure instruments translates to high flux error values - over 10% for a typical instrument - when used for 100-μs Continuous Pulse measurements. The error declines at longer pulse widths but longer pulses produce more heating, negating the benefit of the Continuous Pulse technique.
Source-measure instruments fall short in this application because they are designed for general purpose parametric measurements. The current regulation elements are typically under software or firmware control. Because of this fact, the instrument timing has a large uncertainty, sometimes as much as 10% of the pulse width. Amplifier characteristics are also designed to minimize overshoot under any load condition. The resulting slow rise and fall times (30-500 μs) are not ideal for Continuous Pulse measurements.
Performance current sources minimize errors
Specialized instruments such as the SpikeSafe 400 Performance Precision Pulsed current source have advanced features that are optimized for LED and laser diode testing. For example, The SpikeSafe 400's on-the-fly automatic pulsewidth adjustment improves pulsewidth accuracy to better than ±1 μs, and its programmable load tuning improves rise and fall time performance to better than 2 μs. The result is near-ideal current pulses that produce repeatable, accurate Continuous Pulse measurements (Fig. 7).
To overcome the measurement roadblock and correctly value LEDs, the LED industry must transition to test techniques that minimize junction and phosphor heating. Recent improvements to the popular DC and Single Pulse methods are not enough. While the improvements compensate for the junction heating that occurs during a measurement, many high-efficacy LEDs heat too quickly to be testable. Even with the errors identified, LM-85's straightforward Continuous Pulse method minimizes heating and holds the best promise for delivering accurate, repeatable measurements.
REFERENCES
1. Cree® XLamp® XM-L color LEDs product family datasheet, CLD-DS58 Rev 5.
2. G.-H. Ryu and H.-Y. Ryu, "Analysis of the temperature dependence of phosphor conversion efficiency in white light-emitting diodes," J. Optical Society of Korea, Vol. 19, No. 3, 311-331, June 2015.
3. "How are LEDs affected by heat," NLPIP Lighting Answers, Vol. 7, Iss. 3, Lighting Resource Center, Rensselaer Polytechnic Institute, Troy, NY, May 2003.
4. J. Piprek, "Simple test reveals the origin of efficiency droop," LED Journal Guest Blog, Oct. 12, 2015.
5. Y. Ohno, "Overview of measurement standards for solid state lighting," 2016 CIE-USNC Annual Meeting, Oct. 31, 2016.
6. IES LM-85-14, Approved Method: Electrical and Photometric Measurements of High-Power LEDs, Illuminating Engineering Society of North America, 2014.
7. J. Jiao, "IES LM-85 homogenizes high-power LED measurement and characterization," LEDs Magazine, Vol. 11, Iss. 7, 55-58, Feb. 2014.
8. J. Hulett, "Implementation and comparison of the LM-85 measurement methods," 2014 CIE-USNC Annual Meeting, Oct. 7, 2014.
9. J. Hulett, "Optimizing continuous pulse LED measurements for maximum accuracy," 2016 CIE-USNC Annual Meeting, Oct. 31, 2016.
10. J. Hulett, "Improved photometric testing for high-power LEDs," Photonics Spectra, May 2015.
11. 2651A 50A, High Power System SourceMeter® SMU instrument datasheet, Keithley.
12. 2461 SourceMeter ® SMU instrument ,1000W, 10A pulse, 7A DC datasheet, Keithley.
13. SpikeSafe 400 precision pulsed current source specifications, Vektrex.
JEFF HULETT is the founder and CTO of Vektrex Electronic Systems Inc. (vektrex.com).
*Updated 2:35pm March 13, 2017, for clarification.



![The DesignLights Consortium continues to make progress in shifting outdoor lighting products and implementation practices toward a more restrained and thoughtful strategy. [Image does not represent a DLC qualified fixture.] The DesignLights Consortium continues to make progress in shifting outdoor lighting products and implementation practices toward a more restrained and thoughtful strategy. [Image does not represent a DLC qualified fixture.]](https://img.ledsmagazine.com/files/base/ebm/leds/image/2024/08/66be810888ae93f656446f61-dreamstime_m_265700653.png?auto=format,compress&fit=&q=45&h=139&height=139&w=250&width=250)